Status of Gateway Connections
The Connections section of the Status tab contains information regarding the status of Gateway connections to external systems. This includes systems like databases, devices, and even other Gateways within the Gateway Network. This section allows you to easily find problems with anything connected to the Gateway, and find any necessary information about the faulty connection.
EAM Agents
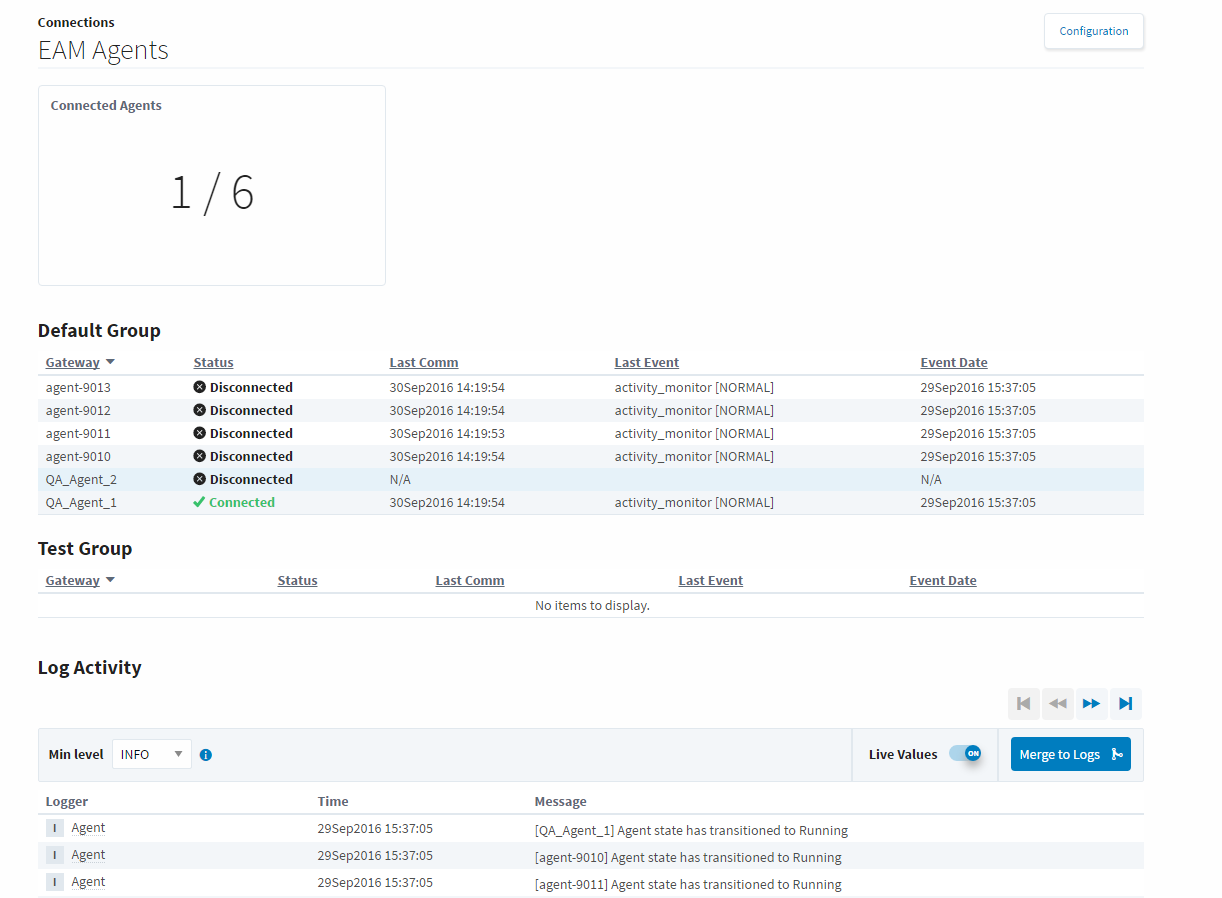
The EAM Agents page shows all of the currently configured Agents, and will give some information on the connection status. At the bottom of the page, there is a log that shows the recent events that relate to the Agent connections.
Databases
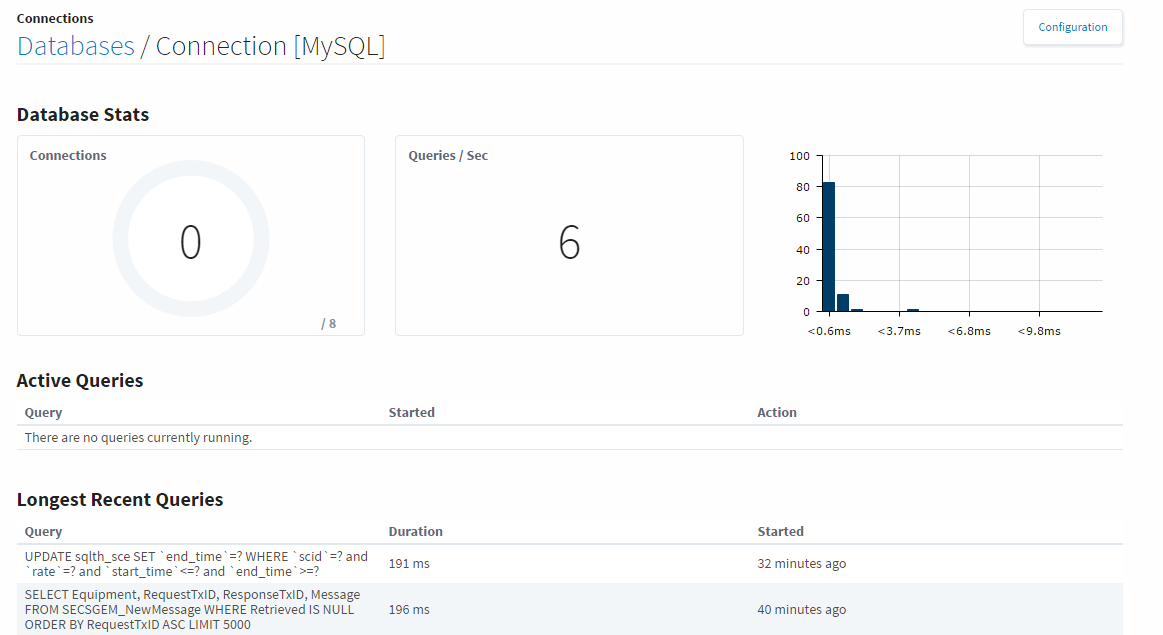
The Databases page shows a List of configured databases, and if they have a valid connection or not. Clicking on the details button to the right of a connection will either show the full error if the connection is faulted, or it will bring you to a details screen for that database connection. On the details screen, easily find recent long running queries, the number of queries a second that are happening, as well as a trend showing the percentage of queries that completed in that time.
Designers
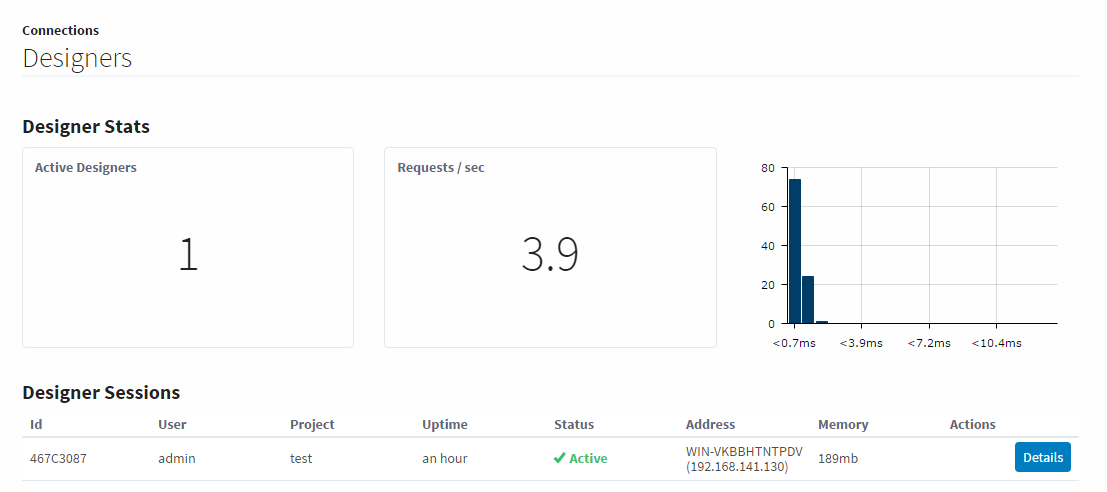
The designers page displays information regarding currently running designers. The open designers are listed and there is some basic information displayed about them such as what user is logged into that designer session and the project they are currently working on. Clicking on the details button to the right of a designer will display more information about that particular designer. On the details page, we can see the session information, as well as what designer locks the designer session currently has. This is when the designer is working on a particular page or set of pages, it gets a look on those resources to prevent other designers from working on the same resource. There will also be a log at the bottom of the page of any errors pertaining to that designer session.
Devices
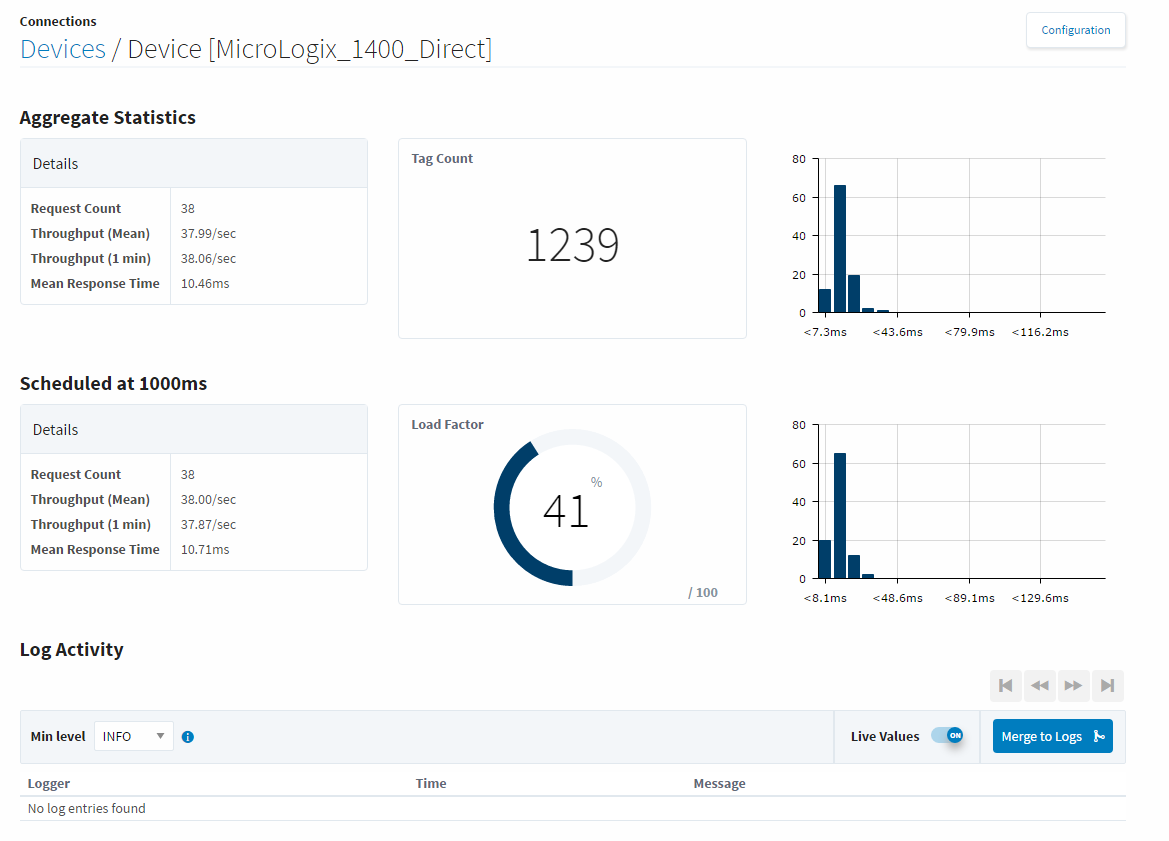
The Devices pages lists the currently configured devices, and let you know which are conencted and which have a faulty connection. Clicking the details button to the right will display a Diagnostics page for that device which shows a lot of useful metrics like a tag count to ensure the device isn't getting overloaded. The log at the bottom of the page will display recent events that pertain to that particular device.
Gateway Network
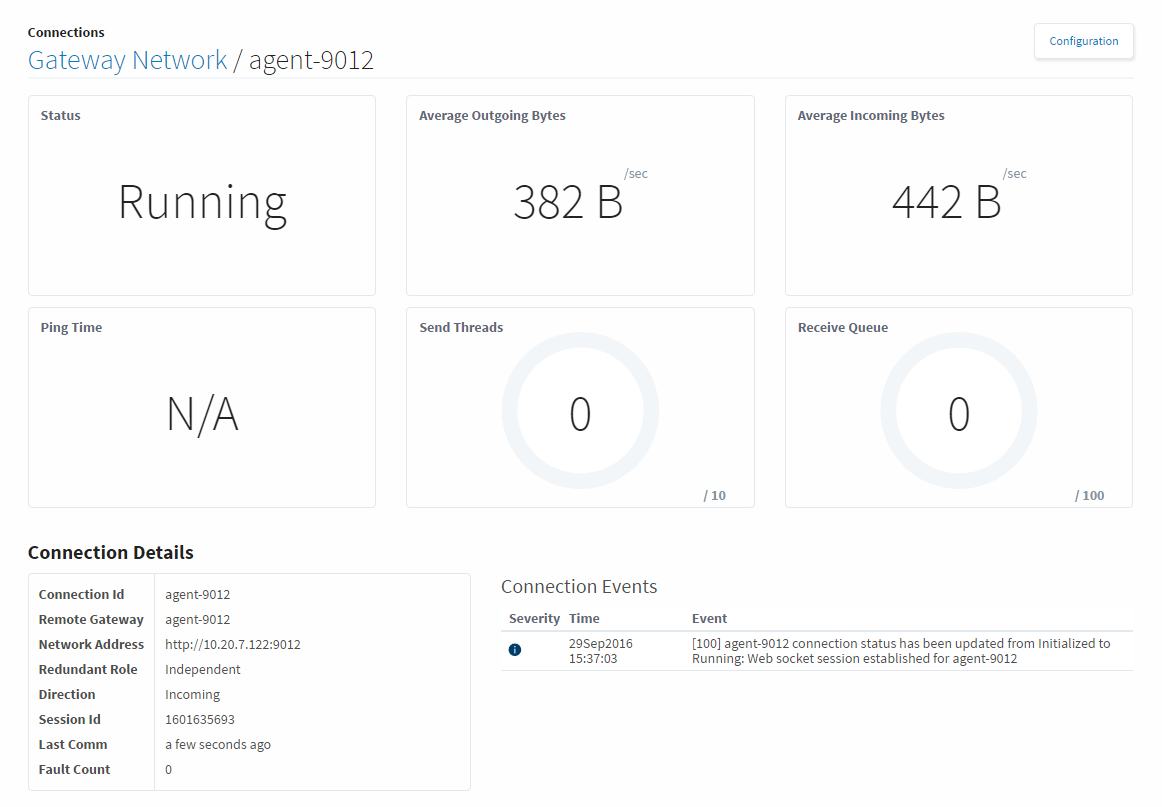
The Gateway Network page is designed to give a quick overview of the status of all Gateways within the Gateway Network. If the Gateway is faulted, it can be selected to see an error that pertains to why it is faulted. Any Gateways with good connected can be drilled into by clicking the details button to the right. On the new page, some metrics for the selected Gateway are displayed, giving an idea of the rate of data transfer between the two Gateways, as well as a list of recent connection events.
Store and Forward
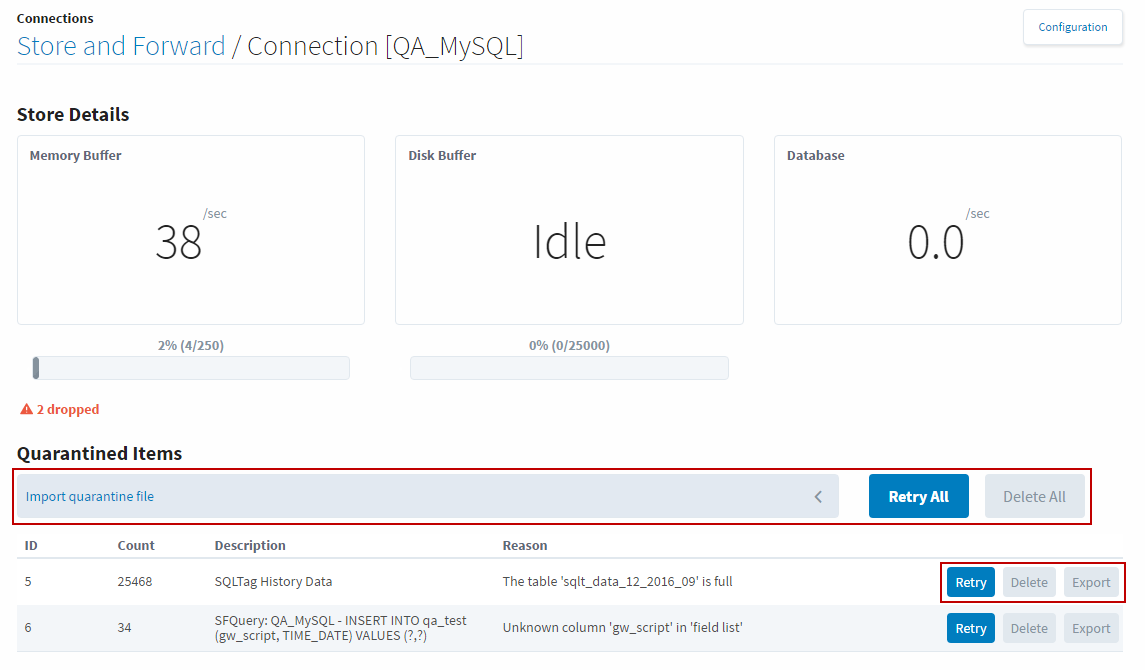
The Store and Forward page contains a list of the Store and Forward Engines, and will show their status, as well as the number of records currently in each Store and Forward system. If the database connection becomes faulted, the database records will wait in the store and forward system until the database connection is restored. Clicking the details button will bring up a new window that will show more details about the records in that particular Store and Forward Engine. Here we can see a count of the number of records in the memory buffer and disk cache, as well as the number of quarantined records. The quarantined items at the bottom of the page will have some buttons that allow you to control the data that is in the quarantine. It can be retried, where it will be thrown back through the Store and Forward system to see if it will go through properly now assuming the original reason why it was quarantined has been fixed. It can be deleted so that it is no longer taking up space in the Store and Forward system. It can also be exported to your local machine, where you can save it to try again later. The you can import the file back on the same page when you have resolved the issue that caused the data to be quarantined in the first place.
OPC Connections
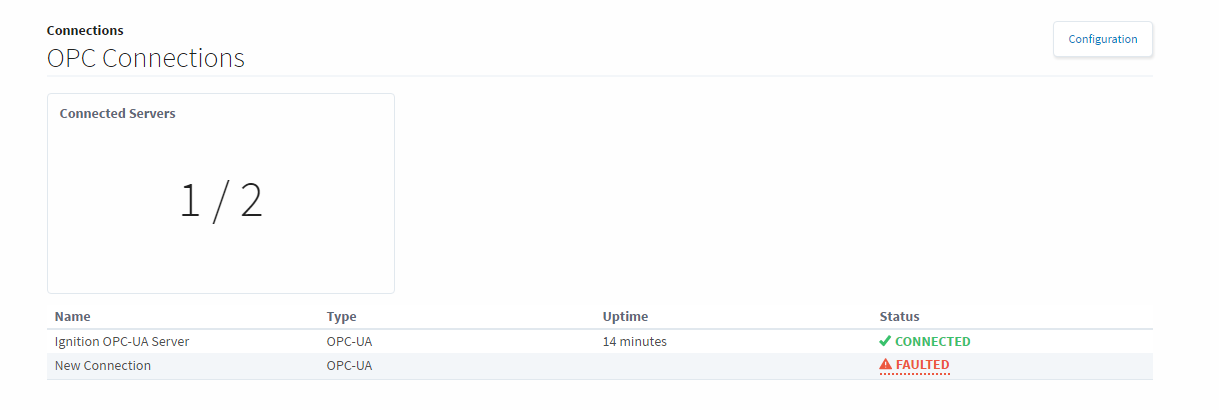
The OPC Connections page displays all currently configured OPC-UA connections. If they are faulted, the erro can be clicked on to get a full description of what is errored.
OPC-UA Server
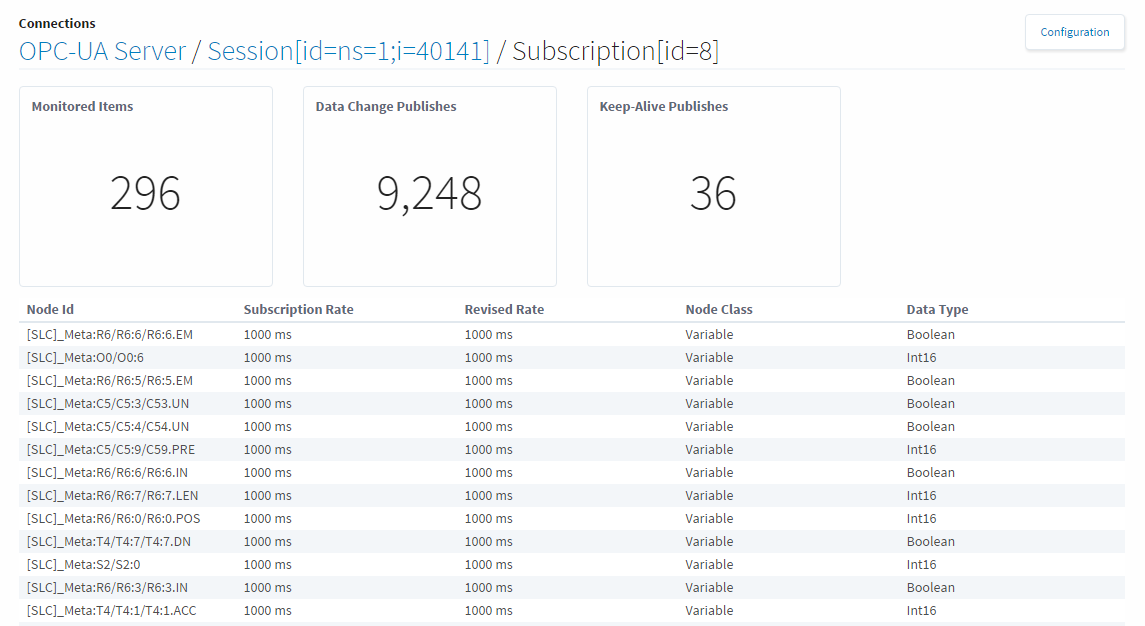
The OPC-UA Server page contains a list of all the OPC Tags configured within Ignition. Opening the page shows a list of OPC Server sessions. Hitting the details button on one of the sessions will bring up a new page with the number of subscriptions that server has, with their scan rate and how many tags are monitored in that subscription at the specified rate. Clicking the details button for one of the subscriptions will bring up the list of subscribed OPC items.
Vision Clients
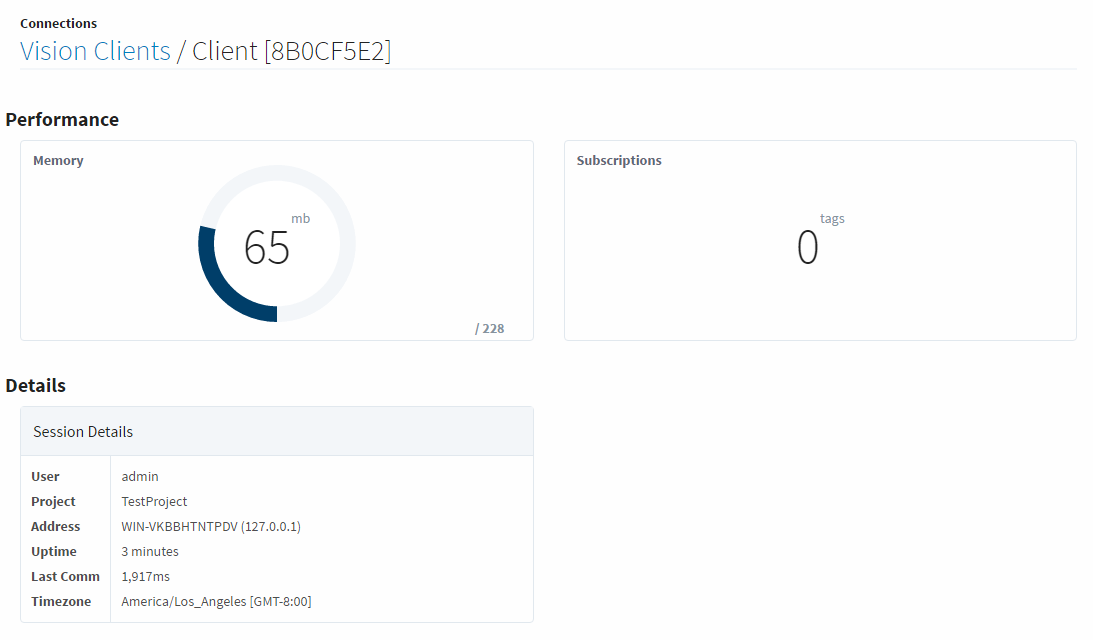
Much like the Designers page, the Vision Clients page shows information regarding currently opened Clients. The Clients are listed and show some basic information such as the address of the Client. From here, the Client session can be terminated by selecting the more button and hitting terminate, or the details option can be selected, and more details about the client session can be seen. The Client Details screen shows more information about the client like the number of tags that the session is currently subscribed to, as well as a log of an errors that may have happened with that Client.
Similar Topics ...