Row Selector Component
The Row Selector is a component that allows users to filter a DataSet based on unique values of one or more columns. Each level in the sorting tree is based on these properties.
Additional information on the Row Selector can be found on the Row Selector page in the appendix.
The user will see a dynamically generated expandable tree that groups their data by any number of choices. As they click down the tree, objects bound to the DataSet will indicate the filtered data. Here are a few examples.
-
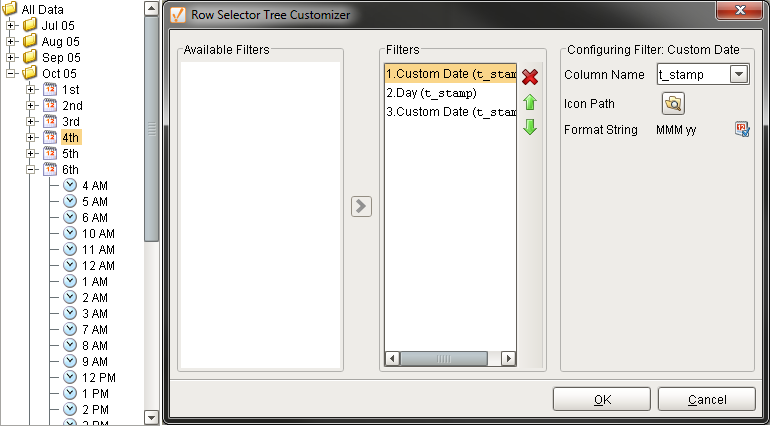
A line graph bound to a Row Selector. Set up grouping to be first by month and year, then day, then hour, like the top left illustration. Clicking on a month and year will dynamically update the graph for that time period. Further clicking to a specific day or hour will re-filter the graph for that period.
-
A Report Viewer bound to a Row Selector. Grouping by department (String) would allow selection by department, automatically regenerating the Report on selection.
-
An "alarm history" table bound to a Row Selector. This could first be broken down severity level (Integer), then broken into "Alarm Acknowledged" / "Not Acknowledged" (Boolean based). Clicking "Severity 3" would filter the table to all Severity 3 alarms. Selecting "Unacknowledged" would then filter the table to unacknowledged alarms of severity 3