Monitoring the Pipeline Status
It’s possible to monitor the status of your alarm notification pipelines to see exactly where your alarms are in the notification process in Ignition. You can do this from the Ignition Gateway Webpage in your browser.
-
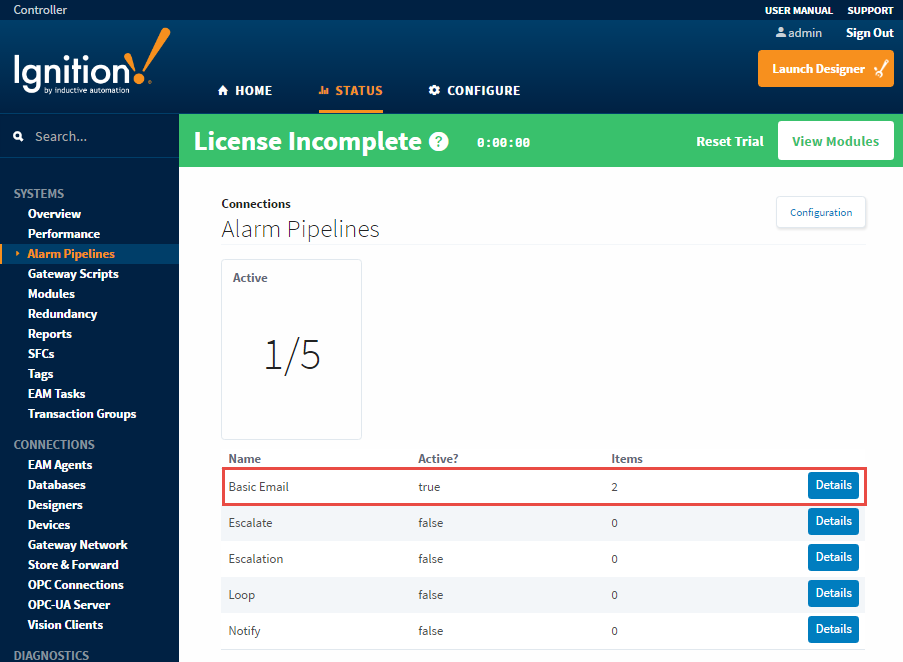
Go to the Status tab of your Gateway webpage and on the left side of the navigation bar, click on Systems > Alarm Pipelines. The Alarm Pipeline page will open and display the status of all your Alarm Pipelines. This example shows five pipelines with one active pipeline for Basic Email and four inactive pipelines.
-
To see a detailed status of any of your alarm pipelines, click the Details tab for any of your alarms. This example shows that the Basic Email pipeline has two active alarms. The Details shows you the affected Source Path, Display Path, Pipeline Block, Status and the length of Time stuck in a pipeline block. You can Cancel the alarm to delete it from the pipeline, and view the logs by clicking on the Pipeline Logs tab.
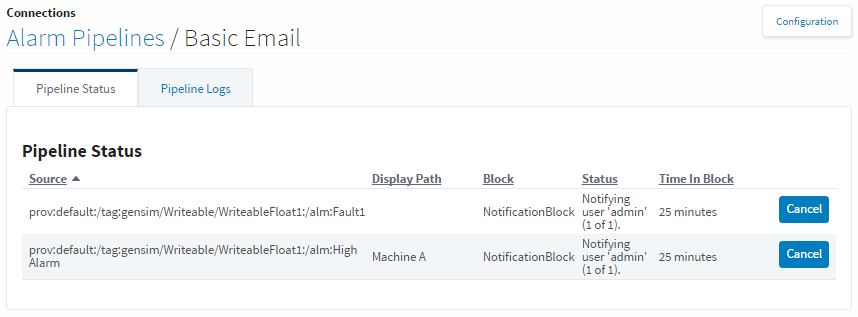
How long an alarm stays in the in the Alarm Pipeline Status depends on how the pipeline is configured, the type of notification (i.e., Email, SMS or Voice), and what the pipeline is doing (i.e., notifying users, looping, caught in a delay, executing a script, etc.,).