Easy Chart - Calculated Pens
This section assumes that Tags and Tag History have been configured
To learn more, go to the Tag and Set up Tags to Log pages.
The examples below use OPC Tags, but Memory, Expression, and Query Tags could be used instead.
Using Calculated Pens
Using calculated pens on an Easy Chart allow you to display a graph of a calculation based off of another pen such as a Moving Average, Upper Control Limit (UCL), Lower Control Limit (LCL), Min, Max, and many more function types. You can have one or more calculated pens on your Easy Chart.
Let's add some calculated pens to an Easy Chart.
-
Right click on the Easy Chart component, and scroll down to Customizers > Easy Chart Customizer.
-
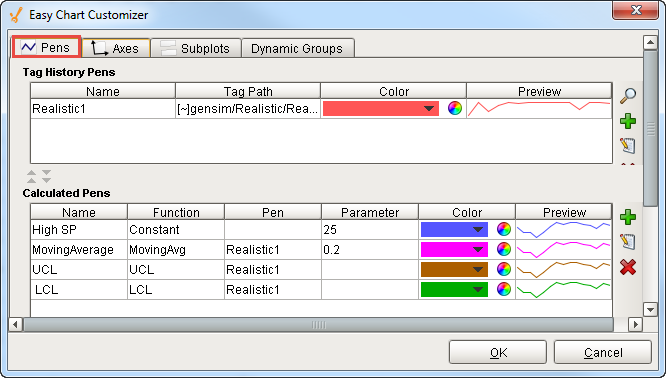
The Pens tab will open and you'll notice a Calculated Pens Table at the bottom of the screen. You can add one or more calculated pens by clicking the green plus icon.
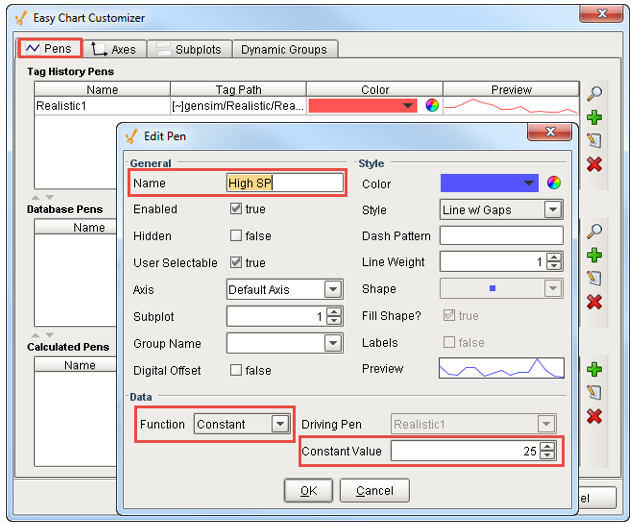
Add a calculated pen name called 'High SP.' In the Function field, select 'Constant' from the dropdown list, and set the 'Constant Value' at '25.' Click OK.
Pens
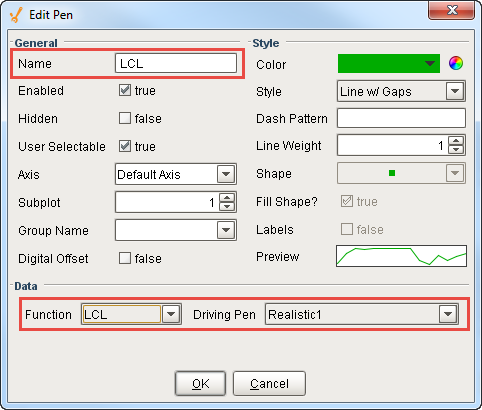
Calculated pens are just like other pens, so you can specify the style, color, axis and subplot in the Edit Pen window.
-
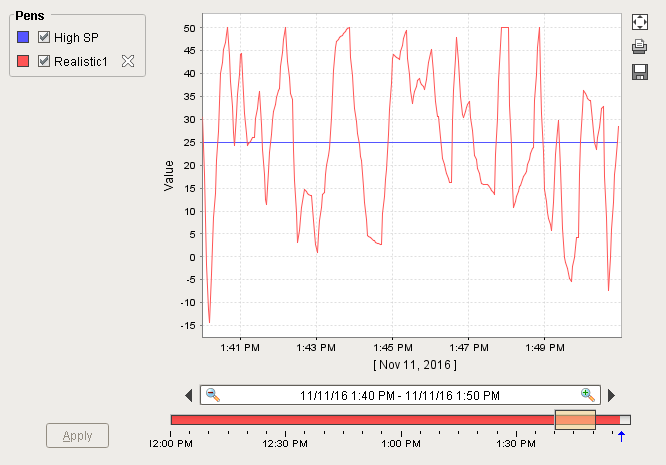
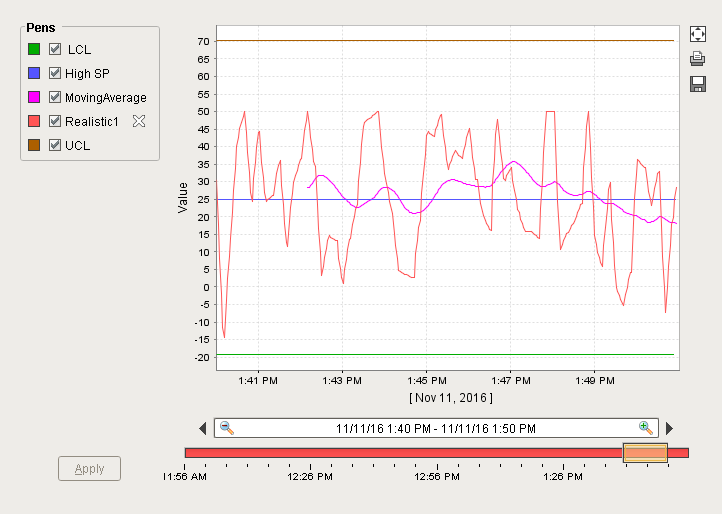
Press OK again to view your High SP pen on your Easy Chart. The High SP value of 25 is represented on your Easy Chart by a blue horizontal line.
-
Lets add a second calculated pen. On the Pens tab, click the green plus icon on the Calculated Pens Table.
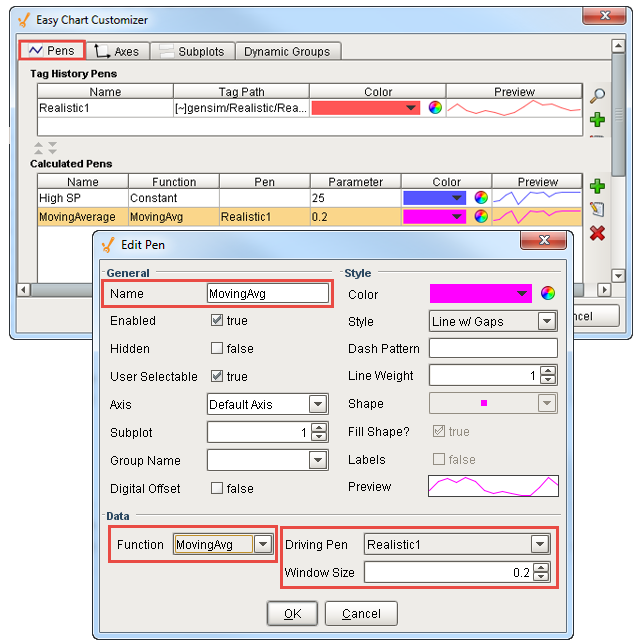
On the Edit Pen window, enter the calculated pen name called 'Moving Average.' In the Function field, select 'MovingAvg' from the dropdown list. Set the Driving Pen to 'Realistic1,' also from the dropdown list. (If you have more Tags that you dragged on to your Easy Chart from the Tag Browser, you'll have more pens to choose from in the Driving Pen dropdown list).
Specify the Window Size which is the percentage of the total time period that you are going to do a Moving Average on, for example 20%. Press OK.
-
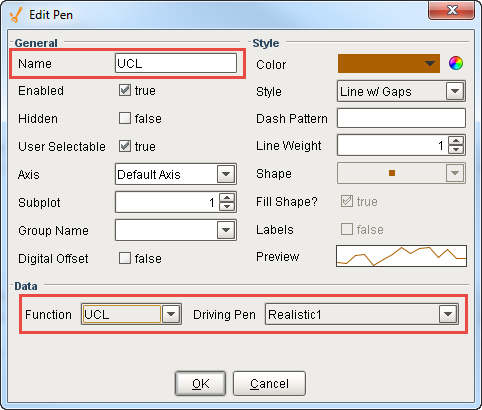
Lets add two more calculated pens: one for Upper Control Limit (UCL) and another for Lower Control Limit (LCL), and set the Driving Property to 'Realistic1.'
-
Once you added all your calculated pens, you'll see all your pens in the Calculated Pens Table at bottom of the window. Press OK.
-
Now, all your calculations are displayed on your Easy Chart. The blue pen is the Constant, the pink pen is the Moving Average, and UCL and LCL are brown and green respectively.
Note
You cannot bind the Calculated Pen values inside the Easy Chart Customizer. To bind the function values, use the Cell Update Binding.
Hide Driving Pens
Once you have your Calculated Pens created, you'll notice that hey disappear if you disable the pen driving them. If you want to remove the Driving Pen but leave the Calculated Pens, set the Hidden property of the Driving Pen.
Similar Topics ...